
Research ArticleMetabolismVascular biology
Open Access |  10.1172/jci.insight.202675
Macrophage TREM2 is a triglyceride-rich lipoprotein receptor that undergoes shedding in prediabetic hepatic steatosis
Jingjing Tang,1 Jenny E. Kanter,1 Baohai Shao,1 Masami Shimizu-Albergine,1 Farah Kramer,1 Ah Reum Khang,1 Jason Luo,1 Huaqing Zheng,1 Alan Tran,1 Jocelyn Cervantes,1 Jeremy M. Frey,1 Mauricio D. Dorfman,1 Cheng-Chieh Hsu,1 Laura J. den Hartigh,1 Tomas Vaisar,1 Brandon S.J. Davies,2,3 Adam E. Mullick,4 George N. Ioannou,5,6 Gordon I. Smith,7 Samuel Klein,7 Nicholas O. Davidson,8 and Karin E. Bornfeldt1,9
1Department of Medicine, Division of Metabolism, Endocrinology and Nutrition, University of Washington Medicine Diabetes Institute, University of Washington, Seattle, Washington, USA.
2Department of Biochemistry and Molecular Biology, and
3Fraternal Order of Eagles Diabetes Research Center, University of Iowa, Iowa City, Iowa, USA.
4Ionis Pharmaceuticals, Carlsbad, California, USA.
5Research and Development and Division of Gastroenterology, Veterans Affairs Puget Sound Health Care System, Seattle, Washington, USA.
6Division of Gastroenterology, University of Washington, Seattle, Washington, USA.
7Department of Medicine, Division of Nutritional Science & Obesity Medicine, and
8Division of Gastroenterology, Washington University School of Medicine, Saint Louis, Missouri, USA.
9Department of Laboratory Medicine and Pathology, University of Washington Medicine Diabetes Institute, University of Washington, Seattle, Washington, USA.
Address correspondence to: Karin Bornfeldt, University of Washington School of Medicine, Department of Medicine, 750 Republican Street, Seattle, Washington, 98109, USA. Email: bornf@uw.edu.
Find articles by Tang, J. in: PubMed | Google Scholar
1Department of Medicine, Division of Metabolism, Endocrinology and Nutrition, University of Washington Medicine Diabetes Institute, University of Washington, Seattle, Washington, USA.
2Department of Biochemistry and Molecular Biology, and
3Fraternal Order of Eagles Diabetes Research Center, University of Iowa, Iowa City, Iowa, USA.
4Ionis Pharmaceuticals, Carlsbad, California, USA.
5Research and Development and Division of Gastroenterology, Veterans Affairs Puget Sound Health Care System, Seattle, Washington, USA.
6Division of Gastroenterology, University of Washington, Seattle, Washington, USA.
7Department of Medicine, Division of Nutritional Science & Obesity Medicine, and
8Division of Gastroenterology, Washington University School of Medicine, Saint Louis, Missouri, USA.
9Department of Laboratory Medicine and Pathology, University of Washington Medicine Diabetes Institute, University of Washington, Seattle, Washington, USA.
Address correspondence to: Karin Bornfeldt, University of Washington School of Medicine, Department of Medicine, 750 Republican Street, Seattle, Washington, 98109, USA. Email: bornf@uw.edu.
Find articles by Kanter, J. in: PubMed | Google Scholar
1Department of Medicine, Division of Metabolism, Endocrinology and Nutrition, University of Washington Medicine Diabetes Institute, University of Washington, Seattle, Washington, USA.
2Department of Biochemistry and Molecular Biology, and
3Fraternal Order of Eagles Diabetes Research Center, University of Iowa, Iowa City, Iowa, USA.
4Ionis Pharmaceuticals, Carlsbad, California, USA.
5Research and Development and Division of Gastroenterology, Veterans Affairs Puget Sound Health Care System, Seattle, Washington, USA.
6Division of Gastroenterology, University of Washington, Seattle, Washington, USA.
7Department of Medicine, Division of Nutritional Science & Obesity Medicine, and
8Division of Gastroenterology, Washington University School of Medicine, Saint Louis, Missouri, USA.
9Department of Laboratory Medicine and Pathology, University of Washington Medicine Diabetes Institute, University of Washington, Seattle, Washington, USA.
Address correspondence to: Karin Bornfeldt, University of Washington School of Medicine, Department of Medicine, 750 Republican Street, Seattle, Washington, 98109, USA. Email: bornf@uw.edu.
Find articles by
Shao, B.
in:
PubMed
|
Google Scholar
|

1Department of Medicine, Division of Metabolism, Endocrinology and Nutrition, University of Washington Medicine Diabetes Institute, University of Washington, Seattle, Washington, USA.
2Department of Biochemistry and Molecular Biology, and
3Fraternal Order of Eagles Diabetes Research Center, University of Iowa, Iowa City, Iowa, USA.
4Ionis Pharmaceuticals, Carlsbad, California, USA.
5Research and Development and Division of Gastroenterology, Veterans Affairs Puget Sound Health Care System, Seattle, Washington, USA.
6Division of Gastroenterology, University of Washington, Seattle, Washington, USA.
7Department of Medicine, Division of Nutritional Science & Obesity Medicine, and
8Division of Gastroenterology, Washington University School of Medicine, Saint Louis, Missouri, USA.
9Department of Laboratory Medicine and Pathology, University of Washington Medicine Diabetes Institute, University of Washington, Seattle, Washington, USA.
Address correspondence to: Karin Bornfeldt, University of Washington School of Medicine, Department of Medicine, 750 Republican Street, Seattle, Washington, 98109, USA. Email: bornf@uw.edu.
Find articles by
Shimizu-Albergine, M.
in:
PubMed
|
Google Scholar
|
1Department of Medicine, Division of Metabolism, Endocrinology and Nutrition, University of Washington Medicine Diabetes Institute, University of Washington, Seattle, Washington, USA.
2Department of Biochemistry and Molecular Biology, and
3Fraternal Order of Eagles Diabetes Research Center, University of Iowa, Iowa City, Iowa, USA.
4Ionis Pharmaceuticals, Carlsbad, California, USA.
5Research and Development and Division of Gastroenterology, Veterans Affairs Puget Sound Health Care System, Seattle, Washington, USA.
6Division of Gastroenterology, University of Washington, Seattle, Washington, USA.
7Department of Medicine, Division of Nutritional Science & Obesity Medicine, and
8Division of Gastroenterology, Washington University School of Medicine, Saint Louis, Missouri, USA.
9Department of Laboratory Medicine and Pathology, University of Washington Medicine Diabetes Institute, University of Washington, Seattle, Washington, USA.
Address correspondence to: Karin Bornfeldt, University of Washington School of Medicine, Department of Medicine, 750 Republican Street, Seattle, Washington, 98109, USA. Email: bornf@uw.edu.
Find articles by Kramer, F. in: PubMed | Google Scholar
1Department of Medicine, Division of Metabolism, Endocrinology and Nutrition, University of Washington Medicine Diabetes Institute, University of Washington, Seattle, Washington, USA.
2Department of Biochemistry and Molecular Biology, and
3Fraternal Order of Eagles Diabetes Research Center, University of Iowa, Iowa City, Iowa, USA.
4Ionis Pharmaceuticals, Carlsbad, California, USA.
5Research and Development and Division of Gastroenterology, Veterans Affairs Puget Sound Health Care System, Seattle, Washington, USA.
6Division of Gastroenterology, University of Washington, Seattle, Washington, USA.
7Department of Medicine, Division of Nutritional Science & Obesity Medicine, and
8Division of Gastroenterology, Washington University School of Medicine, Saint Louis, Missouri, USA.
9Department of Laboratory Medicine and Pathology, University of Washington Medicine Diabetes Institute, University of Washington, Seattle, Washington, USA.
Address correspondence to: Karin Bornfeldt, University of Washington School of Medicine, Department of Medicine, 750 Republican Street, Seattle, Washington, 98109, USA. Email: bornf@uw.edu.
Find articles by Khang, A. in: PubMed | Google Scholar
1Department of Medicine, Division of Metabolism, Endocrinology and Nutrition, University of Washington Medicine Diabetes Institute, University of Washington, Seattle, Washington, USA.
2Department of Biochemistry and Molecular Biology, and
3Fraternal Order of Eagles Diabetes Research Center, University of Iowa, Iowa City, Iowa, USA.
4Ionis Pharmaceuticals, Carlsbad, California, USA.
5Research and Development and Division of Gastroenterology, Veterans Affairs Puget Sound Health Care System, Seattle, Washington, USA.
6Division of Gastroenterology, University of Washington, Seattle, Washington, USA.
7Department of Medicine, Division of Nutritional Science & Obesity Medicine, and
8Division of Gastroenterology, Washington University School of Medicine, Saint Louis, Missouri, USA.
9Department of Laboratory Medicine and Pathology, University of Washington Medicine Diabetes Institute, University of Washington, Seattle, Washington, USA.
Address correspondence to: Karin Bornfeldt, University of Washington School of Medicine, Department of Medicine, 750 Republican Street, Seattle, Washington, 98109, USA. Email: bornf@uw.edu.
Find articles by Luo, J. in: PubMed | Google Scholar
1Department of Medicine, Division of Metabolism, Endocrinology and Nutrition, University of Washington Medicine Diabetes Institute, University of Washington, Seattle, Washington, USA.
2Department of Biochemistry and Molecular Biology, and
3Fraternal Order of Eagles Diabetes Research Center, University of Iowa, Iowa City, Iowa, USA.
4Ionis Pharmaceuticals, Carlsbad, California, USA.
5Research and Development and Division of Gastroenterology, Veterans Affairs Puget Sound Health Care System, Seattle, Washington, USA.
6Division of Gastroenterology, University of Washington, Seattle, Washington, USA.
7Department of Medicine, Division of Nutritional Science & Obesity Medicine, and
8Division of Gastroenterology, Washington University School of Medicine, Saint Louis, Missouri, USA.
9Department of Laboratory Medicine and Pathology, University of Washington Medicine Diabetes Institute, University of Washington, Seattle, Washington, USA.
Address correspondence to: Karin Bornfeldt, University of Washington School of Medicine, Department of Medicine, 750 Republican Street, Seattle, Washington, 98109, USA. Email: bornf@uw.edu.
Find articles by Zheng, H. in: PubMed | Google Scholar
1Department of Medicine, Division of Metabolism, Endocrinology and Nutrition, University of Washington Medicine Diabetes Institute, University of Washington, Seattle, Washington, USA.
2Department of Biochemistry and Molecular Biology, and
3Fraternal Order of Eagles Diabetes Research Center, University of Iowa, Iowa City, Iowa, USA.
4Ionis Pharmaceuticals, Carlsbad, California, USA.
5Research and Development and Division of Gastroenterology, Veterans Affairs Puget Sound Health Care System, Seattle, Washington, USA.
6Division of Gastroenterology, University of Washington, Seattle, Washington, USA.
7Department of Medicine, Division of Nutritional Science & Obesity Medicine, and
8Division of Gastroenterology, Washington University School of Medicine, Saint Louis, Missouri, USA.
9Department of Laboratory Medicine and Pathology, University of Washington Medicine Diabetes Institute, University of Washington, Seattle, Washington, USA.
Address correspondence to: Karin Bornfeldt, University of Washington School of Medicine, Department of Medicine, 750 Republican Street, Seattle, Washington, 98109, USA. Email: bornf@uw.edu.
Find articles by Tran, A. in: PubMed | Google Scholar
1Department of Medicine, Division of Metabolism, Endocrinology and Nutrition, University of Washington Medicine Diabetes Institute, University of Washington, Seattle, Washington, USA.
2Department of Biochemistry and Molecular Biology, and
3Fraternal Order of Eagles Diabetes Research Center, University of Iowa, Iowa City, Iowa, USA.
4Ionis Pharmaceuticals, Carlsbad, California, USA.
5Research and Development and Division of Gastroenterology, Veterans Affairs Puget Sound Health Care System, Seattle, Washington, USA.
6Division of Gastroenterology, University of Washington, Seattle, Washington, USA.
7Department of Medicine, Division of Nutritional Science & Obesity Medicine, and
8Division of Gastroenterology, Washington University School of Medicine, Saint Louis, Missouri, USA.
9Department of Laboratory Medicine and Pathology, University of Washington Medicine Diabetes Institute, University of Washington, Seattle, Washington, USA.
Address correspondence to: Karin Bornfeldt, University of Washington School of Medicine, Department of Medicine, 750 Republican Street, Seattle, Washington, 98109, USA. Email: bornf@uw.edu.
Find articles by Cervantes, J. in: PubMed | Google Scholar
1Department of Medicine, Division of Metabolism, Endocrinology and Nutrition, University of Washington Medicine Diabetes Institute, University of Washington, Seattle, Washington, USA.
2Department of Biochemistry and Molecular Biology, and
3Fraternal Order of Eagles Diabetes Research Center, University of Iowa, Iowa City, Iowa, USA.
4Ionis Pharmaceuticals, Carlsbad, California, USA.
5Research and Development and Division of Gastroenterology, Veterans Affairs Puget Sound Health Care System, Seattle, Washington, USA.
6Division of Gastroenterology, University of Washington, Seattle, Washington, USA.
7Department of Medicine, Division of Nutritional Science & Obesity Medicine, and
8Division of Gastroenterology, Washington University School of Medicine, Saint Louis, Missouri, USA.
9Department of Laboratory Medicine and Pathology, University of Washington Medicine Diabetes Institute, University of Washington, Seattle, Washington, USA.
Address correspondence to: Karin Bornfeldt, University of Washington School of Medicine, Department of Medicine, 750 Republican Street, Seattle, Washington, 98109, USA. Email: bornf@uw.edu.
Find articles by Frey, J. in: PubMed | Google Scholar
1Department of Medicine, Division of Metabolism, Endocrinology and Nutrition, University of Washington Medicine Diabetes Institute, University of Washington, Seattle, Washington, USA.
2Department of Biochemistry and Molecular Biology, and
3Fraternal Order of Eagles Diabetes Research Center, University of Iowa, Iowa City, Iowa, USA.
4Ionis Pharmaceuticals, Carlsbad, California, USA.
5Research and Development and Division of Gastroenterology, Veterans Affairs Puget Sound Health Care System, Seattle, Washington, USA.
6Division of Gastroenterology, University of Washington, Seattle, Washington, USA.
7Department of Medicine, Division of Nutritional Science & Obesity Medicine, and
8Division of Gastroenterology, Washington University School of Medicine, Saint Louis, Missouri, USA.
9Department of Laboratory Medicine and Pathology, University of Washington Medicine Diabetes Institute, University of Washington, Seattle, Washington, USA.
Address correspondence to: Karin Bornfeldt, University of Washington School of Medicine, Department of Medicine, 750 Republican Street, Seattle, Washington, 98109, USA. Email: bornf@uw.edu.
Find articles by Dorfman, M. in: PubMed | Google Scholar
1Department of Medicine, Division of Metabolism, Endocrinology and Nutrition, University of Washington Medicine Diabetes Institute, University of Washington, Seattle, Washington, USA.
2Department of Biochemistry and Molecular Biology, and
3Fraternal Order of Eagles Diabetes Research Center, University of Iowa, Iowa City, Iowa, USA.
4Ionis Pharmaceuticals, Carlsbad, California, USA.
5Research and Development and Division of Gastroenterology, Veterans Affairs Puget Sound Health Care System, Seattle, Washington, USA.
6Division of Gastroenterology, University of Washington, Seattle, Washington, USA.
7Department of Medicine, Division of Nutritional Science & Obesity Medicine, and
8Division of Gastroenterology, Washington University School of Medicine, Saint Louis, Missouri, USA.
9Department of Laboratory Medicine and Pathology, University of Washington Medicine Diabetes Institute, University of Washington, Seattle, Washington, USA.
Address correspondence to: Karin Bornfeldt, University of Washington School of Medicine, Department of Medicine, 750 Republican Street, Seattle, Washington, 98109, USA. Email: bornf@uw.edu.
Find articles by Hsu, C. in: PubMed | Google Scholar
1Department of Medicine, Division of Metabolism, Endocrinology and Nutrition, University of Washington Medicine Diabetes Institute, University of Washington, Seattle, Washington, USA.
2Department of Biochemistry and Molecular Biology, and
3Fraternal Order of Eagles Diabetes Research Center, University of Iowa, Iowa City, Iowa, USA.
4Ionis Pharmaceuticals, Carlsbad, California, USA.
5Research and Development and Division of Gastroenterology, Veterans Affairs Puget Sound Health Care System, Seattle, Washington, USA.
6Division of Gastroenterology, University of Washington, Seattle, Washington, USA.
7Department of Medicine, Division of Nutritional Science & Obesity Medicine, and
8Division of Gastroenterology, Washington University School of Medicine, Saint Louis, Missouri, USA.
9Department of Laboratory Medicine and Pathology, University of Washington Medicine Diabetes Institute, University of Washington, Seattle, Washington, USA.
Address correspondence to: Karin Bornfeldt, University of Washington School of Medicine, Department of Medicine, 750 Republican Street, Seattle, Washington, 98109, USA. Email: bornf@uw.edu.
Find articles by den Hartigh, L. in: PubMed | Google Scholar
1Department of Medicine, Division of Metabolism, Endocrinology and Nutrition, University of Washington Medicine Diabetes Institute, University of Washington, Seattle, Washington, USA.
2Department of Biochemistry and Molecular Biology, and
3Fraternal Order of Eagles Diabetes Research Center, University of Iowa, Iowa City, Iowa, USA.
4Ionis Pharmaceuticals, Carlsbad, California, USA.
5Research and Development and Division of Gastroenterology, Veterans Affairs Puget Sound Health Care System, Seattle, Washington, USA.
6Division of Gastroenterology, University of Washington, Seattle, Washington, USA.
7Department of Medicine, Division of Nutritional Science & Obesity Medicine, and
8Division of Gastroenterology, Washington University School of Medicine, Saint Louis, Missouri, USA.
9Department of Laboratory Medicine and Pathology, University of Washington Medicine Diabetes Institute, University of Washington, Seattle, Washington, USA.
Address correspondence to: Karin Bornfeldt, University of Washington School of Medicine, Department of Medicine, 750 Republican Street, Seattle, Washington, 98109, USA. Email: bornf@uw.edu.
Find articles by Vaisar, T. in: PubMed | Google Scholar
1Department of Medicine, Division of Metabolism, Endocrinology and Nutrition, University of Washington Medicine Diabetes Institute, University of Washington, Seattle, Washington, USA.
2Department of Biochemistry and Molecular Biology, and
3Fraternal Order of Eagles Diabetes Research Center, University of Iowa, Iowa City, Iowa, USA.
4Ionis Pharmaceuticals, Carlsbad, California, USA.
5Research and Development and Division of Gastroenterology, Veterans Affairs Puget Sound Health Care System, Seattle, Washington, USA.
6Division of Gastroenterology, University of Washington, Seattle, Washington, USA.
7Department of Medicine, Division of Nutritional Science & Obesity Medicine, and
8Division of Gastroenterology, Washington University School of Medicine, Saint Louis, Missouri, USA.
9Department of Laboratory Medicine and Pathology, University of Washington Medicine Diabetes Institute, University of Washington, Seattle, Washington, USA.
Address correspondence to: Karin Bornfeldt, University of Washington School of Medicine, Department of Medicine, 750 Republican Street, Seattle, Washington, 98109, USA. Email: bornf@uw.edu.
Find articles by Davies, B. in: PubMed | Google Scholar
1Department of Medicine, Division of Metabolism, Endocrinology and Nutrition, University of Washington Medicine Diabetes Institute, University of Washington, Seattle, Washington, USA.
2Department of Biochemistry and Molecular Biology, and
3Fraternal Order of Eagles Diabetes Research Center, University of Iowa, Iowa City, Iowa, USA.
4Ionis Pharmaceuticals, Carlsbad, California, USA.
5Research and Development and Division of Gastroenterology, Veterans Affairs Puget Sound Health Care System, Seattle, Washington, USA.
6Division of Gastroenterology, University of Washington, Seattle, Washington, USA.
7Department of Medicine, Division of Nutritional Science & Obesity Medicine, and
8Division of Gastroenterology, Washington University School of Medicine, Saint Louis, Missouri, USA.
9Department of Laboratory Medicine and Pathology, University of Washington Medicine Diabetes Institute, University of Washington, Seattle, Washington, USA.
Address correspondence to: Karin Bornfeldt, University of Washington School of Medicine, Department of Medicine, 750 Republican Street, Seattle, Washington, 98109, USA. Email: bornf@uw.edu.
Find articles by
Mullick, A.
in:
PubMed
|
Google Scholar
|
1Department of Medicine, Division of Metabolism, Endocrinology and Nutrition, University of Washington Medicine Diabetes Institute, University of Washington, Seattle, Washington, USA.
2Department of Biochemistry and Molecular Biology, and
3Fraternal Order of Eagles Diabetes Research Center, University of Iowa, Iowa City, Iowa, USA.
4Ionis Pharmaceuticals, Carlsbad, California, USA.
5Research and Development and Division of Gastroenterology, Veterans Affairs Puget Sound Health Care System, Seattle, Washington, USA.
6Division of Gastroenterology, University of Washington, Seattle, Washington, USA.
7Department of Medicine, Division of Nutritional Science & Obesity Medicine, and
8Division of Gastroenterology, Washington University School of Medicine, Saint Louis, Missouri, USA.
9Department of Laboratory Medicine and Pathology, University of Washington Medicine Diabetes Institute, University of Washington, Seattle, Washington, USA.
Address correspondence to: Karin Bornfeldt, University of Washington School of Medicine, Department of Medicine, 750 Republican Street, Seattle, Washington, 98109, USA. Email: bornf@uw.edu.
Find articles by Ioannou, G. in: PubMed | Google Scholar
1Department of Medicine, Division of Metabolism, Endocrinology and Nutrition, University of Washington Medicine Diabetes Institute, University of Washington, Seattle, Washington, USA.
2Department of Biochemistry and Molecular Biology, and
3Fraternal Order of Eagles Diabetes Research Center, University of Iowa, Iowa City, Iowa, USA.
4Ionis Pharmaceuticals, Carlsbad, California, USA.
5Research and Development and Division of Gastroenterology, Veterans Affairs Puget Sound Health Care System, Seattle, Washington, USA.
6Division of Gastroenterology, University of Washington, Seattle, Washington, USA.
7Department of Medicine, Division of Nutritional Science & Obesity Medicine, and
8Division of Gastroenterology, Washington University School of Medicine, Saint Louis, Missouri, USA.
9Department of Laboratory Medicine and Pathology, University of Washington Medicine Diabetes Institute, University of Washington, Seattle, Washington, USA.
Address correspondence to: Karin Bornfeldt, University of Washington School of Medicine, Department of Medicine, 750 Republican Street, Seattle, Washington, 98109, USA. Email: bornf@uw.edu.
Find articles by Smith, G. in: PubMed | Google Scholar
1Department of Medicine, Division of Metabolism, Endocrinology and Nutrition, University of Washington Medicine Diabetes Institute, University of Washington, Seattle, Washington, USA.
2Department of Biochemistry and Molecular Biology, and
3Fraternal Order of Eagles Diabetes Research Center, University of Iowa, Iowa City, Iowa, USA.
4Ionis Pharmaceuticals, Carlsbad, California, USA.
5Research and Development and Division of Gastroenterology, Veterans Affairs Puget Sound Health Care System, Seattle, Washington, USA.
6Division of Gastroenterology, University of Washington, Seattle, Washington, USA.
7Department of Medicine, Division of Nutritional Science & Obesity Medicine, and
8Division of Gastroenterology, Washington University School of Medicine, Saint Louis, Missouri, USA.
9Department of Laboratory Medicine and Pathology, University of Washington Medicine Diabetes Institute, University of Washington, Seattle, Washington, USA.
Address correspondence to: Karin Bornfeldt, University of Washington School of Medicine, Department of Medicine, 750 Republican Street, Seattle, Washington, 98109, USA. Email: bornf@uw.edu.
Find articles by
Klein, S.
in:
PubMed
|
Google Scholar
|
1Department of Medicine, Division of Metabolism, Endocrinology and Nutrition, University of Washington Medicine Diabetes Institute, University of Washington, Seattle, Washington, USA.
2Department of Biochemistry and Molecular Biology, and
3Fraternal Order of Eagles Diabetes Research Center, University of Iowa, Iowa City, Iowa, USA.
4Ionis Pharmaceuticals, Carlsbad, California, USA.
5Research and Development and Division of Gastroenterology, Veterans Affairs Puget Sound Health Care System, Seattle, Washington, USA.
6Division of Gastroenterology, University of Washington, Seattle, Washington, USA.
7Department of Medicine, Division of Nutritional Science & Obesity Medicine, and
8Division of Gastroenterology, Washington University School of Medicine, Saint Louis, Missouri, USA.
9Department of Laboratory Medicine and Pathology, University of Washington Medicine Diabetes Institute, University of Washington, Seattle, Washington, USA.
Address correspondence to: Karin Bornfeldt, University of Washington School of Medicine, Department of Medicine, 750 Republican Street, Seattle, Washington, 98109, USA. Email: bornf@uw.edu.
Find articles by
Davidson, N.
in:
PubMed
|
Google Scholar
|
1Department of Medicine, Division of Metabolism, Endocrinology and Nutrition, University of Washington Medicine Diabetes Institute, University of Washington, Seattle, Washington, USA.
2Department of Biochemistry and Molecular Biology, and
3Fraternal Order of Eagles Diabetes Research Center, University of Iowa, Iowa City, Iowa, USA.
4Ionis Pharmaceuticals, Carlsbad, California, USA.
5Research and Development and Division of Gastroenterology, Veterans Affairs Puget Sound Health Care System, Seattle, Washington, USA.
6Division of Gastroenterology, University of Washington, Seattle, Washington, USA.
7Department of Medicine, Division of Nutritional Science & Obesity Medicine, and
8Division of Gastroenterology, Washington University School of Medicine, Saint Louis, Missouri, USA.
9Department of Laboratory Medicine and Pathology, University of Washington Medicine Diabetes Institute, University of Washington, Seattle, Washington, USA.
Address correspondence to: Karin Bornfeldt, University of Washington School of Medicine, Department of Medicine, 750 Republican Street, Seattle, Washington, 98109, USA. Email: bornf@uw.edu.
Find articles by
Bornfeldt, K.
in:
PubMed
|
Google Scholar
|
Published August 27, 2026 - More info
JCI Insight. 2026;11(19):e202675. https://doi.org/10.1172/jci.insight.202675.
© 2026 Tang et al. This work is licensed under the Creative Commons Attribution 4.0 International License. To view a copy of this license, visit http://creativecommons.org/licenses/by/4.0/.
Received: November 20, 2025; Accepted: August 21, 2026


-
Results
Plasma sTREM2 is positively associated with APOC3 and increased concentrations of large to midsized TRL particles in individuals with MASLD and prediabetes. We first investigated whether there is a link between plasma sTREM2 and APOC3 in individuals with MASLD in 3 cohorts (Supplemental Table 1; supplemental material available online with this article; https://doi.org/10.1172/jci.insight.202675DS1). Although there were differences in several parameters between the cohorts, such as age and BMI, sTREM2 levels correlated positively with APOC3, with 28% of variation in APOC3 explained by sTREM2 in individuals with MASLD (Figure 1A). Moreover, both sTREM2 and APOC3 correlated positively with plasma TG levels (P = 1.45 × 10⁻⁴, r2 = 0.49 and P = 1.46 × 10⁻³, r2 = 0.36, respectively).
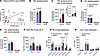 Figure 1
In individuals with MASLD and prediabetes, plasma sTREM2 is associated with plasma APOC3 and concentrations of APOC3-enriched TRL particles are increased. (A) Plasma samples from individuals with MASLD were analyzed for APOC3 and sTREM2 levels by ELISAs (cohorts 1–3; Supplemental Table 1). (B and C) Apolipoproteins in isolated TRLs (density < 1.019 g/mL) from individuals with normal liver fat (n = 10) versus individuals (n = 10) with glucose intolerance and high liver fat (MASLD) were analyzed by targeted mass spectrometry (cohort 1; Supplemental Table 1). Relative levels of APOB48 are shown as an insert in C. (D and E) Apolipoproteins in isolated LDL (density 1.08–1.019 g/mL) from individuals with normal liver fat (n = 10) versus individuals (n = 10) with glucose intolerance and high liver fat were analyzed by targeted mass spectrometry. (F) Total concentrations of TRL and LDL particles in the isolated density fractions were determined by calibrated ion mobility analysis. (G) TRL subpopulation particle size and concentrations (TRL-P) were measured by calibrated ion mobility analysis. (H) LDL subpopulation particle size and concentrations (LDL-P) were measured by calibrated ion mobility analysis. The 18–19 nm LDL population corresponds to small dense LDL. Mean ± SEM (B–H). Statistical analyses: Pearson’s correlation (A), 2-way ANOVA with Šídák’s multiple-comparison test (B–H). See Supporting Data Values for group sizes and statistics.
We next investigated the content of APOC3 in TRL and LDL in a cohort closely matched for age, sex, and BMI; one group with normal intrahepatic TG content and normal glucose tolerance, and one group with elevated intrahepatic TG content and prediabetes (Supplemental Table 1, cohort 1). Individuals with prediabetes and elevated intrahepatic TG content exhibited higher APOC3 levels associated primarily with TRLs (Figure 1, B–E). There were no differences between the groups in TRL or LDL APOE, an apolipoprotein that facilitates hepatic clearance of TRLs. Moreover, the relative TRL content of APOB48 was higher in the group with elevated intrahepatic TG levels and prediabetes than in the group with normal liver TG content, consistent with increased levels of chylomicron-derived (APOB48-containing) TRLs (Figure 1C, insert). Therefore, TRLs in individuals with elevated liver fat and prediabetes are likely a mixture of VLDL and chylomicron remnants.
Next, we measured concentrations of size-defined TRL and LDL subpopulations by calibrated ion mobility analysis. Individuals with elevated intrahepatic TGs and prediabetes exhibited higher total concentrations of TRL particles (TRL-P) than individuals free of these conditions, with an increase primarily in the large to midsized TRLs of 35–45 nm and 45–60 nm diameter (Figure 1, F and G). There were no differences in LDL particle concentrations or size distributions (Figure 1, F and H).
Together, these results show that individuals with increased intrahepatic TG content and prediabetes have higher plasma concentrations of TRL particles in the large to midsized range and higher concentrations of sTREM2-, APOC3-, and APOC3-enriched TRLs.
Plasma sTREM2 and APOC3 are increased in a mouse model of prediabetes and hepatic steatosis. To investigate the mechanisms and consequences of the link between sTREM2 and APOC3, we used an LDL receptor–deficient (Ldlr–/–) mouse model of diet-induced prediabetes and hepatic steatosis. In this mouse model, like in humans (Figure 1A), a positive correlation between plasma sTREM2 and APOC3 was evident (Figure 2A). Compared with littermate controls fed a standard laboratory diet (SLD, chow diet), mice fed a diabetogenic diet with added cholesterol (DDC) exhibited elevated plasma sTREM2, APOC3, TGs, cholesterol, and free fatty acids (Figure 2, B–F). The elevated plasma lipids were due in part to an increased number of APOB-containing lipoprotein particles, as evidenced by the elevated levels of APOB and the large increase primarily in TRL particles and TRL remnants in plasma samples separated by size-exclusion chromatography (Figure 2, G and H). Consistently, ion mobility analysis demonstrated significant increases in TRL particle concentrations, particularly in TRL subpopulations in the 28 nm and 35 nm range (Figure 2I). Note that TRL sizes were smaller in mice than in humans.
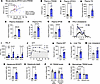 Figure 2
Plasma sTREM2 and APOC3 are increased in a mouse model of prediabetes and hepatic steatosis. (A) Plasma APOC3 and sTREM2 were measured by ELISAs in samples collected from Ldlr–/– mice fed a diabetogenic diet (DDC) for 0–2 weeks (n = 16), 3–5 weeks (n = 15), and 6–8 weeks (n = 10). (B–G) Plasma sTREM2, APOC3, triglycerides, cholesterol, free fatty acids (FFAs), and total APOB (measured by an antibody that binds to the N-terminus; APOB-Nt) levels in Ldlr–/– mice fed an SLD or DDC for 22 weeks. (H) Cholesterol lipoprotein profile at the 22-week time point. RLP, remnant lipoprotein particle. (I) TRLs were isolated from mouse plasma (d < 0.019 g/mL), and TRL subpopulation particle concentrations (TRL-P) and sizes were measured by ion mobility analysis. (J) Glucose tolerance tests at 20 weeks. (K) Plasma AST at 22 weeks. (L) Liver triglycerides. (M) Liver cholesterol. (N and O) Hepatocytes were isolated and analyzed for lipid loading (BODIPY) and viability (7AAD) by flow cytometry. (P and Q) Total TREM2 and cell surface TREM2 were measured by flow cytometry in permeabilized and non-permeabilized Kupffer cells (KCs), respectively, and infiltrated macrophages in the liver. Mean ± SEM (B–Q). Statistical analyses: Pearson’s correlation (A), Mann-Whitney (B–G and K–O), 2-way ANOVA with Šídák’s multiple-comparison test (I and J), 2-way ANOVA with Tukey’s multiple-comparison test (P and Q). See Supporting Data Values for group sizes and statistics.
Consistent with the existence of prediabetes, mice fed DDC were glucose intolerant compared with SLD-fed controls (Figure 2J). The liver phenotype was consistent with MASLD, with increased plasma aspartate aminotransferase (AST) levels indicating liver injury and elevated hepatic TGs with a nonsignificant (P = 5.53 × 10⁻²) increase in liver cholesterol (Figure 2, K–M). Moreover, hepatocytes exhibited increased lipid loading, measured by flow cytometry as BODIPY-positive hepatocytes (Figure 2N), and approximately 8% of hepatocytes were positive for 7AAD, indicating hepatocyte death (Figure 2O).
Liver bulk RNA-seq revealed increased expression of macrophage markers, such as Cd68, C1qb, and C1qc, with reduced expression of genes involved in cholesterol biosynthesis, such as Cyp51, Hmgcr, and Fdft1 (Supplemental Figure 1). Increased hepatic inflammation and reduced cholesterol biosynthesis, indicative of increased ER cholesterol (24), were supported by gene set enrichment analysis (GSEA).
Flow cytometry was used to identify Kupffer cells (CD45+F4/80hiCD11bInt CLEC4F+ cells) and infiltrated hepatic myeloid cells (CD45+F4/80loCD11bhiCLEC4F–). A majority of immunoreactive TREM2 was localized at the cell surface in Kupffer cells (Figure 2P). Cell-surface TREM2 levels were reduced in Kupffer cells from DDC-fed mice, which contributed to a nonsignificant decrease in total cellular levels of TREM2. These results support increased TREM2 shedding in DDC-fed mice, consistent with the elevated plasma sTREM2. Moreover, the increased shedding of TREM2 was evident in the Kupffer cells and not in infiltrated myeloid cells (Figure 2Q).
Together, this mouse model of prediabetes and hepatic steatosis shows a positive correlation of plasma sTREM2 with APOC3, like in humans, and that the sTREM2 is derived, at least in part, from activated Kupffer cells.
Macrophage full-length TREM2 lowers plasma TRLs by reducing APOC3 and APOB secretion rates and increasing TRL lipid clearance rates. Next, to investigate whether macrophage TREM2 is directly responsible for regulating APOC3 and APOB levels, we analyzed apolipoprotein levels and kinetics in 3 Ldlr–/– BM chimeras fed DDC: (a) Trem2–/– hematopoietic chimeras (TREM2H–/– mice), (b) chimeras deficient in ADAM17 in myeloid cells (ADAM17M–/– mice), and (c) BM WT chimeras. Because ADAM17 is the principal TREM2 sheddase (14), ADAM17M–/– mice have higher levels of myeloid full-length (non-shed) TREM2. Accordingly, plasma sTREM2 levels were lower in ADAM17M–/– mice and were much lower in TREM2H–/– mice than in Ldlr–/– mice receiving WT BM (Figure 3A). Although the relative numbers of Kupffer cells (as a percentage of total hepatic leukocytes) did not differ between the groups, cell-surface TREM2 levels were markedly higher in Kupffer cells from ADAM17M–/– mice than in both WT and TREM2H–/– mice (Figure 3, B and C). Consistent with the increased ADAM17 activation and shedding of TREM2 in WT mice fed DDC, Kupffer cell surface TREM2 did not differ significantly between WT and TREM2H–/– mice, suggesting that TREM2 shedding is nearly maximal in Kupffer cells in DDC-fed WT mice.
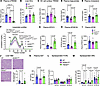 Figure 3
Macrophage full-length TREM2 lowers plasma TRLs by reducing APOC3 and APOB secretion rates. Ldlr–/– mice were transplanted with BM from WT mice, myeloid Adam17–/– mice, or Trem2–/– mice. After a 7-week recovery period, the mice were fed DDC for 18 weeks. (A) Plasma sTREM2 levels were measured by ELISA at 18 weeks of DDC. (B) Liver Kupffer cells (KCs) were quantified as CLEC4F+ CD11b+ F4/80hi cells as a percentage of total liver CD45+ cells by flow cytometry. (C) Cell-surface TREM2 levels (MFI) in the hepatic KC population. (D and E) Plasma triglyceride and cholesterol levels. (F) Cholesterol lipoprotein profiles. RLP, remnant lipoprotein particle. (G) Plasma APOC3 levels. (H and I) Plasma APOB100 and total APOB levels. (J) H&E-stained liver sections and quantification of lipid vacuolar area as a percentage of total analyzed slide area (1.92 mm2). Scale bar: 100 μm. (K) Plasma AST levels. (L and M) Apolipoprotein kinetics measured by targeted mass spectrometry after a bolus injection of Lys8. (L) Fractional clearance rates (FCRs). (M) Secretion rates (SRs). Statistical analyses: 1-way ANOVA with Tukey’s multiple-comparison test (A–C), Kruskal-Wallis with Dunn’s multiple-comparison test (D, E, and G–K), 2-way ANOVA with Tukey’s multiple-comparison test (F, L, and M). See Supporting Data Values for group sizes and statistics.
Macrophage TREM2 deficiency caused elevated plasma TG and cholesterol levels, as compared with myeloid ADAM17-deficient mice in which Kupffer cells carried higher levels of full-length TREM2 (Figure 3, D and E). Ldlr–/– WT hematopoietic chimeras had plasma lipid levels similar to those of hematopoietic TREM2-deficient mice, in agreement with the lower levels of full-length TREM2 due to increased shedding in those mice. Cholesterol lipoprotein profiles revealed that TREM2H–/– chimeras had higher TRL cholesterol and remnant/LDL cholesterol than myeloid ADAM17 chimeras and modestly higher TRL cholesterol than WT chimeras (Figure 3F). Thus, loss of macrophage TREM2, as compared with the increased levels of surface TREM2 in the ADAM17M–/– mice, increases TRL and remnant/LDL cholesterol levels.
Plasma APOC3 levels were higher in TREM2H–/– mice than in ADAM17M–/– mice (Figure 3G). A similar pattern was observed for plasma APOB100, showing a higher concentration of APOB100 lipoprotein particles (VLDL, VLDL remnants, and LDL) in TREM2H–/– mice versus ADAM17M–/– mice (Figure 3H). No significant differences were observed in total APOB levels (Figure 3I). The increased plasma APOC3 levels were not due to increased hepatic transcription because hepatic Apoc3 mRNA levels were decreased in TREM2H–/– mice compared with WT chimeras (–0.47 log2 fold-change [log2FC] TREM2H–/– versus WT; adjusted P = 0.011) and slightly increased in the ADAM17M–/– mice (0.29 log2FC ADAM17M–/– versus WT; adjusted P = 0.049). Therefore, increased levels of macrophage full-length TREM2 suppresses plasma APOC3 and APOB100 lipoprotein particles through a posttranscriptional mechanism.
Hematopoietic WT chimeras and TREM2H–/– mice showed hepatic lipid vacuoles and elevated plasma AST levels, while ADAM17M–/– mice were protected (Figure 3, J and K). These results are consistent with the interpretation that preserving full-length TREM2 on Kupffer cells (and likely on other macrophage populations) in the presence of hepatic steatosis and prediabetes suppresses both hepatic injury and APOC3 and APOB100 lipoprotein concentrations.
To gain mechanistic insight, bulk RNA-seq was performed on the livers of these mice. RNA-seq confirmed that Trem2 mRNA was the most significantly downregulated gene in the TREM2-deficient BM chimeras (–3.56 log2FC TREM2H–/– versus WT; adjusted P = 5.47 × 10⁻¹⁸; see Supporting Data Values, tab Figure S2A). Comparisons of transcriptomic signatures in livers of TREM2H–/– mice (lack of macrophage TREM2) with ADAM17M–/– mice (increased levels of full-length non-shed TREM2) by GSEA and ingenuity pathway analysis (IPA, QIAGEN) revealed increased signatures of cholesterol biosynthesis, fatty acid/acyl-CoA metabolism, and COPII-mediated vesicle transport pathways involved in VLDL generation and secretion (Supplemental Figure 2, A–C). These results, together with other pathways significantly enriched in the TREM2H–/– mice, such as fatty acyl-CoA biogenesis (adjusted P = 1.02 × 10⁻³, z score 1.67), glycerophospholipid biosynthesis (adjusted P = 1.29 × 10⁻³, z score 1.89), and triacylglycerol biosynthesis (adjusted P = 2.51 × 10⁻³, z score 2.45) suggest increased VLDL secretion in TREM2H–/– mice. Notably, no significant transcriptomic signatures indicated increased apoptosis or reduced efferocytosis. These findings were consistent with the lack of differences in Kupffer cell efferocytosis, measured as CLEC4F/TUNEL double-positive cells in the liver of the different groups of mice (Supplemental Figure 3, A–C).
To confirm increased APOC3 and APOB secretion, we next performed APOC3 and APOB kinetics analyses by 13C6,15N2-lysine heavy isotope tracing. These studies revealed that loss of macrophage TREM2 significantly increased the APOC3 and APOB secretion rates, consistent with the transcriptomic signatures revealed by the RNA-seq analysis, without affecting APOC3 and APOB fractional clearance rates (Figure 3, L and M).
We reasoned that the reduced APOC3 in mice with increased macrophage surface TREM2 levels (caused by myeloid cell ADAM17 deficiency) would increase TRL lipid clearance, since APOC3 prevents hepatic TRL clearance (23). We therefore assessed TRL lipid clearance rates by injecting radiolabeled TRLs into WT and ADAM17M–/– mice and following their clearance from plasma into tissues. These experiments revealed that higher levels of macrophage surface TREM2 resulted in a faster clearance rate of both TRL TGs and TRL cholesterol, with a significant increase in hepatic uptake (Supplemental Figure 4, A–D).
Together, these results demonstrate that macrophage full-length (non-shed) TREM2 causes lower plasma APOC3 and APOB100 levels due to slower APOC3 and APOB secretion rates, and that the lower plasma cholesterol and TGs in these mice are also explained by an increased hepatic uptake of TRL lipids.
sTREM2 alone does not affect APOC3 and APOB100 levels. We next increased sTREM2 levels by an adeno-associated virus (AAV) approach to investigate whether the lower plasma APOC3 and APOB100 levels in ADAM17M–/– mice could be mediated by reduced levels of sTREM2, rather than by higher levels of full-length TREM2. Increased plasma levels of sTREM2 for 18 weeks did not alter plasma lipids, APOC3, APOB100, hepatic steatosis, AST levels, or atherosclerosis (Supplemental Figure 5, A–J), suggesting that increased levels of full-length macrophage TREM2, not sTREM2, regulate plasma APOC3 and APOB100.
Because TREM2 is also expressed in brain microglia, we tested whether DDC-fed ADAM17M–/– mice showed signs of altered hypothalamic gene expression, and thus whether the lowered plasma APOC3 could be explained by central regulation. However, despite functional myeloid cell ADAM17 deficiency and reduced plasma APOC3 levels, there were no detected changes in the hypothalamic expression of genes associated with energy balance or inflammation (Supplemental Figure 6, A–D).
Lack of macrophage TREM2 increases TG, APOC3, and APOB100 levels in conditioned media in macrophage-hepatocyte cocultures. Because full-length TREM2 contributes to the ability of macrophages to take up lipids, we next investigated whether lack of macrophage cell surface TREM2 increases APOC3 and APOB100 levels derived from lipid-loaded hepatocytes, using coculture models of mouse primary macrophages and hepatocytes. Hepatocytes were freshly isolated from Ldlr–/– mice, labeled with Hoechst 33342 (a live cell-permeable dye), and then cocultured with or without BMDMs from WT mice, ADAM17M–/– mice, TREM2-deficient mice, or mice deficient in both TREM2 and ADAM17 (Figure 4A). Oleic acid was added to promote TG accumulation and mimic hepatic steatosis.
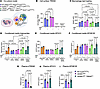 Figure 4
Lack of macrophage TREM2 interaction with hepatocytes drives triglyceride, APOC3, and APOB100 secretion from steatotic hepatocytes. (A) Coculture model. Blue nuclei indicate Hoechst 33342–labeled hepatocytes. (B–F) Hepatocytes were isolated from Ldlr–/– mice labeled with Hoechst 33342 and immediately cocultured for 20 hours with and without BMDMs from WT mice, myeloid-targeted ADAM17M–/– mice, Trem2–/– mice, and mice deficient in both TREM2 and myeloid ADAM17 in the presence of oleic acid (OA) bound to BSA or with BSA alone. Cell-surface TREM2 (B) and lipid loading (BODIPY) of macrophages (C) were analyzed by flow cytometry. TGs, APOC3, and APOB100 in the conditioned media were measured by colorimetric assays and ELISAs (D–F). (G–I) Ldlr–/– mice were transplanted with BM from WT mice, ADAM17M–/– mice, and ADAM17M–/– Trem2–/– mice. After 7 weeks of recovery, the mice were fed DDC for 18 weeks, and plasma sTREM2, APOC3, and APOB100 were measured. Statistical analyses: 2-way ANOVA with Tukey’s multiple-comparison test (B–D), 2-way ANOVA with Šídák’s multiple-comparison test (E and F), Kruskal-Wallis with Dunn’s multiple-comparison test (G and I), 1-way ANOVA with Tukey’s multiple-comparison test (H). See Supporting Data Values for group sizes and statistics.
TREM2 cell-surface levels were higher in ADAM17-deficient macrophages than in WT macrophages and were predictably undetected in TREM2-deficient macrophages and macrophages deficient in both TREM2 and ADAM17 (Figure 4B). ADAM17-mediated shedding of cell-surface TREM2 was most marked in unpolarized BMDMs and in BMDMs activated by inflammatory stimuli but not in alternatively activated BMDMs (Supplemental Figure 7A), consistent with known activators of ADAM17 and the inflammatory environment in the liver of our mouse model. We found no evidence of shedding of MerTK, another ADAM17 substrate (25), under the conditions used in our study (Supplemental Figure 7, B and C).
In agreement with TREM2’s ability to mediate lipid uptake, ADAM17-deficient macrophages, which have higher levels of full-length TREM2 on their surface, were more lipid-loaded than WT macrophages, and TREM2-deficient macrophages were less lipid loaded (Figure 4C). Macrophages deficient in both TREM2 and ADAM17 were also less lipid-loaded than both WT and ADAM17-deficient macrophages, in agreement with the interpretation that ADAM17 mediates its effects on lipid uptake primarily by reduced TREM2 shedding.
Coculture of hepatocytes with either WT or ADAM17-deficient BMDMs suppressed the oleic acid–induced TG, APOC3, and APOB100 levels in conditioned media, whereas coculture with BMDMs lacking TREM2 or both TREM2 and ADAM17 did not result in suppression of oleic acid–induced TG, APOC3, or APOB100 (Figure 4, D–F). Total conditioned media APOB levels did not change significantly with oleic acid incubation (Supplemental Figure 7D), which was expected (26) because APOB100 is more sensitive to the lipid-loaded status of the hepatocyte than APOB48 (27). Note that mouse hepatocytes secrete both APOB100 and APOB48 lipoprotein particles.
To investigate whether these effects of macrophage TREM2 require close proximity between hepatocytes and macrophages, similar coculture experiments were performed in which the hepatocytes and macrophages were physically separated using a Transwell system. Neither hepatocyte lipid loading nor TG, APOC3, or APOB100 secretion were affected by macrophage TREM2 levels when the macrophages were physically separated from the hepatocytes (Supplemental Figure 7, E–H).
Although we did not observe evidence for efferocytosis being affected by TREM2 in vivo, the cell culture system provided an ideal model to quantify macrophage efferocytosis of Hoechst 33342–labeled hepatocytes under controlled conditions. We found that lipid-loaded hepatocytes were engulfed by WT BMDMs at higher levels than hepatocytes not exposed to oleic acid, measured by cells double-positive for the macrophage marker CD115+ and Hoechst 33342 as a percentage of total Hoechst 33342+ cells (Supplemental Figure 8A). Moreover, ADAM17-deficient macrophages were more effective than WT macrophages at efferocytosis, and macrophages deficient in TREM2 or deficient in both ADAM17 and TREM2 were less effective at efferocytosis than WT macrophages, demonstrating that part of ADAM17’s efferocytotic effect is mediated by TREM2 under these conditions. There was a small additional efferocytosis effect in the TREM2-ADAM17 double-deficient macrophages, which was expected because of other known ADAM17 substrates involved in efferocytosis, such as MerTK. However, we did not find evidence for reduced MerTK shedding in the absence of myeloid ADAM17 (Supplemental Figure 7, B and C).
To confirm the role of full-length TREM2 in suppressing APOC3 and APOB100 in vivo, we fed Ldlr–/– mice transplanted with (a) BM from WT (Lyz2Cre/Cre) mice, (b) BM from ADAM17M–/– mice, or (c) BM from mice deficient in both myeloid ADAM17 and TREM2 (ADAM17M–/– Trem2–/–) DDC for 18 weeks. Plasma sTREM2 levels were highest in WT mice and lowest in the ADAM17M–/– TREM2H–/– mice, as expected (Figure 4G). The lower plasma APOC3 and APOB100 levels in ADAM17M–/– mice were prevented by deleting TREM2, supporting the conclusion that TREM2 is the main ADAM17 substrate mediating its effects on APOC3 and APOB100 lipoproteins (Figure 4, H and I). A subsequent validation experiment using the 4 groups of Ldlr–/– mice transplanted with (a) BM from WT (Lyz2Cre/Cre) mice, (b) BM from ADAM17M–/– (Lyz2Cre/Cre) mice, (c) BM from TREM2H–/– (Lyz2Cre/Cre) mice, or (d) BM from mice deficient in both myeloid ADAM17 and TREM2 (ADAM17M–/– TREM2H–/– Lyz2Cre/Cre) on DDC for 12 weeks confirmed these observations and showed no significant differences in plasma APOC3, APOB100, cholesterol, or TGs between WT, TREM2H–/–, and ADAM17M–/– TREM2H–/– mice, with lower levels in ADAM17M–/– mice (Supplemental Table 2).
Together, these results strongly support the proposal that although TREM2 can mediate efferocytosis, the main in vivo effect of TREM2 on TRLs in our models is unlikely to be due to differences in efferocytosis. Instead, macrophage full-length TREM2 mediates a reduction in APOC3 and APOB100 secretion by uptake of TRLs.
TREM2 is a macrophage TRL receptor. To directly test whether TREM2 mediates TRL uptake into macrophages, we incubated BM-derived macrophages from WT, ADAM17-deficient, TREM2-deficient, and ADAM17-TREM2 double-deficient mice with VLDL labeled with 1,1′-dioctadecyl-3,3,3′,3′-tetramethylindocarbocyanine perchlorate (DiI). These experiments revealed that ADAM17-deficient macrophages with higher levels of membrane full-length TREM2 had an increased ability to take up DiI-labeled VLDL, measured as uptake of both the DiI and APOB, whereas macrophages deficient in TREM2 or deficient in both TREM2 and ADAM17 had a markedly reduced ability to do so (Figure 5, A–C). The uptake was time dependent (Figure 5, B and C) and temperature dependent (no DiI-VLDL uptake was observed at 4°C), showing that the process required internalization of the TRL particles.
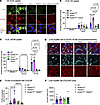 Figure 5
Macrophage TREM2 mediates TRL uptake. (A) BMDMs from the indicated genotypes were incubated in the presence of DiI-VLDL for 30 or 60 minutes or vehicle for 30 minutes. The cells were them immunostained with a goat anti-APOB antibody (Ab7616, 1:500 dilution) followed by a donkey anti-goat Alexa Fluor 488 antibody (green). Cell nuclei were stained with DAPI (blue) and DiI was visualized as red stain. Scale bar: 20 μm. (B) Quantification of DiI uptake/total cell number (nuclei). (C) Quantification of APOB uptake/total cell number (nuclei). Data are shown from 1 representative experiment repeated 3 times in independent cell isolates with similar results. (D) Liver sections from the 4 groups stained with antibodies against CLEC4F (Kupffer cell marker) and PLIN2 (lipid droplet marker). Scale bar: 20 μm. (E) Quantitation of PLIN2 colocalized with CLEC4F. (F) Quantification of CLEC4F area/45,000 μm2. Statistical analyses: 2-way ANOVA with Tukey’s multiple-comparison test (B and C), 1-way ANOVA with Tukey’s multiple-comparison test (E), Kruskal-Wallis with Dunn’s multiple-comparison test (F). See Supporting Data Values for group sizes and statistics.
To provide additional in vivo support for this mechanism, we used IHC to show higher PLIN2 (a marker of lipid droplets) colocalization with CLEC4F (the Kupffer cell marker) in ADAM17M–/– mice than in mice deficient in both ADAM17 and TREM2, without changes in the total CLEC4F area between groups (Figure 5, D–F). Moreover, some of the APOC3 immunoreactivity was colocalized with Kupffer cells (Supplemental Figure 8B), further supporting uptake by Kupffer cells.
Macrophage full-length TREM2 prevents atherosclerosis progression. We next analyzed the effects of macrophage full-length TREM2 on atherosclerosis in Ldlr–/– mice transplanted with BM from WT, TREM2-deficient, or ADAM17M–/– mice. Consistent with the changes in plasma lipids, APOC3, and APOB100 in these mice (Figure 3), loss of hematopoietic TREM2 led to increased aortic sinus atherosclerosis and necrotic core expansion, while preservation of full-length TREM2 by myeloid ADAM17 deficiency reduced atherosclerosis and necrotic cores (Figure 6, A–D).
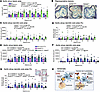 Figure 6
Full-length macrophage TREM2 protects against atherosclerosis. (A–D) Ldlr–/– mice were transplanted with BM from WT mice, Trem2–/– mice, or myeloid Adam17–/– mice. After BM repopulation, the mice were fed DDC for 18 weeks. (A) Aortic sinus lesion area over distance from the appearance of all 3 leaflets. (B) Representative photos. Scale bar: 200 μm. (C) Lesion necrotic core area. (D) Lesion necrotic core area as a percentage of lesion area. (E–G) Ldlr–/– mice were transplanted with BM from WT Lyz2Cre/Cre mice, myeloid Adam17–/– mice, or mice deficient in myeloid ADAM17 and TREM2. (E) Aortic sinus lesion area over distance from the appearance of all 3 leaflets. (F) Lesion necrotic core area. (G) Lesion necrotic core area as a percentage of lesion area and representative lesions. Scale bar: 200 μm. (H) Schematic showing full-length Kupffer cell (KC) TREM2 taking up excess lipid particles, such as APOC3-containing VLDL secreted from hepatocytes, in a healthy liver when ADAM17 is inactive (left), and TREM2 shedding due to inflammation and ADAM17 activation in a steatotic liver in prediabetes, resulting in reduced TREM2-mediated KC uptake of TRLs; an increase in cholesterol, TG, and phospholipid synthesis pathways and VLDL secretion pathways in hepatocytes; and an increase in hepatic VLDL-APOC3 secretion and atherosclerosis (right). Created using BioRender.com. Mean ± SEM. Statistical analyses: 2-way ANOVA with Tukey’s multiple-comparison test (A and C–G). See Supporting Data Values for group sizes and statistics.
To verify that the effects of myeloid cell–targeted ADAM17 deficiency were indeed mediated by increased levels of cell-surface TREM2, we transplanted Ldlr–/– mice with BM from WT mice, ADAM17M–/– mice, or mice lacking both ADAM17 and TREM2 in myeloid cells. These experiments confirmed that the protective effects of myeloid ADAM17 on both lesion size and necrotic core area were prevented when these cells also lacked TREM2 (Figure 6, E–G). These results strongly suggest that full-length (non-shed) TREM2 protects against atherosclerosis and necrotic core expansion in this mouse model. Consistent with the lack of significant differences in efferocytosis in the liver, no differences in efferocytosis were detected in aortic sinus lesions between the groups (Supplemental Figure 8, C–E).


